
Of all the content a real estate agent can create, market update videos have the best ratio of effort-to-results. They take 15 minutes to film, cost nothing to produce, and position you as the local expert that buyers and sellers trust with the biggest financial decision of their lives.
And yet, most agents either do not make them at all or make them so badly that they might as well not bother. I am talking about the 8-minute monologue in front of a beige wall, reading numbers off a spreadsheet with all the charisma of a DMV clerk. No hook. No structure. No reason for anyone to watch past the first 3 seconds.
This guide fixes that. I am giving you three complete script templates you can use this week (monthly recap, trend alert, buyer/seller tip), plus the filming setup, data sources, distribution strategy, and repurposing playbook to turn one video into a full week of content. No prior video experience required. No expensive equipment needed. Just your phone, some local data, and the willingness to press record.
For the broader case for video in real estate marketing, see our video marketing for real estate guide. This article goes deep on one specific type of video content that works particularly well for lead generation and authority building.

Why Market Update Videos Work So Well for Lead Generation
Before we get into scripts and templates, let me explain why this specific content format is so effective. It is not obvious, and understanding the "why" will help you execute the "how" much better.
They Build Authority Over Time
Listing videos sell a specific property. Market update videos sell you. When someone watches your market analysis every month for six months, they are not learning about a house. They are learning about you. They are forming an opinion that you understand the market deeply, that you communicate clearly, and that you are trustworthy. By the time they need an agent, the decision is already made. They are calling you.
This is the compound interest of content marketing. Each video builds on the last. Your 12th monthly update has a very different impact than your first, because by the 12th, you have a track record of consistency that no single piece of content can replicate.
They Attract Buyers AND Sellers
Listing tours mostly attract buyers. Market updates attract both. A buyer watches to understand whether it is a good time to purchase. A seller watches to understand whether it is a good time to list. An investor watches to identify market trends. A homeowner who is not planning to move watches because they are curious about their home's value. You are reaching every segment of your potential client base with one piece of content.
They Have Long Shelf Life
A listing tour becomes irrelevant the moment the property sells. A market update video remains relevant for weeks or months. Someone searching "Austin housing market February 2026" on YouTube might find your video three months after you posted it. That search-driven discovery does not happen with listing content. Market data is evergreen in a way that property-specific content is not.
The data on video performance in real estate backs this up: educational and market analysis content generates 2x to 3x more inbound leads per view than pure listing content, because the viewer is seeking expertise, not just a property.
They Are Easy to Make Consistently
The market changes every month. That means you always have something new to say. You are never staring at a blank screen wondering what to film. The data is the content. Your job is to translate the numbers into plain language that your audience can act on. Once you have a template and a rhythm, producing a monthly market update takes less time than writing a listing description.
What You Need Before You Start
The barrier to entry for market update videos is almost comically low. Here is the complete list of what you actually need.
Equipment (Minimum Viable Setup)
| Item | Budget Option | Cost | Pro Upgrade | Cost |
|---|---|---|---|---|
| Camera | Your smartphone | $0 | Mirrorless camera | $800+ |
| Microphone | Wireless lapel mic | $20 | Rode VideoMicro | $60 |
| Lighting | Window light | $0 | Ring light or softbox | $30 to $80 |
| Tripod/mount | Phone tripod | $15 | Full-size tripod | $50 |
| Background | Clean wall or bookshelf | $0 | Branded backdrop | $100+ |
Total cost for the budget setup: $35. That is less than the cost of one month of your MLS dues. Audio quality matters more than video quality for talking head content. The $20 lapel mic is the single most important purchase on this list. Your phone's built-in microphone picks up room echo, air conditioning noise, and that weird hum from the fluorescent light your landlord refuses to fix. A lapel mic isolates your voice and makes you sound like you know what you are doing.
Data Sources
You need reliable, local data. Here are the best sources, ranked by usefulness for market update videos.
- Your local MLS: The gold standard. Most MLS systems have a statistics dashboard showing active listings, days on market, median price, pending sales, and list-to-sale ratio for your specific area. Some MLS boards publish monthly market reports with pre-formatted charts you can screenshot and use in your videos.
- Altos Research: Provides weekly market data at the zip code level. Their charts are clean and social-media-friendly. Some agents embed Altos widgets directly on their website.
- Your local REALTOR association: Publishes monthly or quarterly market reports, often with commentary and context that saves you research time.
- Redfin Data Center: Free, public data on housing trends at the metro and national level. Good for providing context ("Nationally, inventory is up 12%, but here in [City], we are actually down 3%").
- Freddie Mac / FRED: Current mortgage rate data. Rates impact buyer purchasing power directly, making them relevant to every market update.
- NAR Research: National Association of Realtors publishes monthly existing home sales data, buyer/seller survey results, and economic impact reports.
Pro tip: bookmark these sources and check them on the same day each month. Make it a 30-minute ritual. Pull the data, note anything surprising, and draft your talking points before you film. The research takes longer than the filming.
Script Template 1: The Monthly Market Recap
This is your flagship market update. Post it in the first week of every month covering the previous month's data. Target length: 60 to 90 seconds for social media, 3 to 5 minutes for YouTube.
Structure
HOOK (0 to 10 seconds)
"[City] real estate just had its [most interesting adjective] month in [timeframe]. Here is what the numbers say."
THREE KEY METRICS (10 to 50 seconds)
"Number one: median sale price came in at [$ amount], which is [up/down X%] from last month and [up/down X%] from this time last year. What that means for [buyers/sellers]: [one-sentence practical implication]."
"Number two: there are currently [X] active listings on the market. That is [more/fewer] than last month. We need [X months of inventory] for a balanced market, and right now we are at [X months]. That tells us this is a [buyer's/seller's/balanced] market."
"Number three: homes are selling in an average of [X] days. [That is faster/slower] than [comparison period]. Mortgage rates are sitting at [X%], which means a buyer putting 20% down on a $[X] home is looking at roughly $[X] per month."
WHAT IT MEANS (50 to 70 seconds)
"So what does all of this mean? If you are a buyer: [one specific, actionable takeaway]. If you are a seller: [one specific, actionable takeaway]. If you are a homeowner not planning to move: [one reassuring or informative takeaway]."
CTA (70 to 90 seconds)
"Want to know what this means for your specific neighborhood? DM me '[Keyword]' and I will send you a personalized breakdown. I am [Name], your [City] real estate expert. Follow for monthly updates."
Example Script (Filled In)
Here is what this template looks like with real data plugged in.
"Austin real estate just had its slowest January in three years. Here is what the numbers say."
"Median sale price: $485,000. That is down 2% from December but still up 4% year-over-year. So prices are cooling slightly month-to-month, but if you bought last January, your home is worth about $19,000 more. Not a bad return for doing absolutely nothing."
"Active listings: 4,200 homes on the market. That is up 18% from January last year. We have about 3.2 months of inventory, which puts us in balanced territory. Not a buyer's market yet, but sellers no longer hold all the cards."
"Days on market: 52. That is eight days longer than last January. Homes are still selling, but buyers are taking their time, negotiating harder, and walking away from overpriced listings."
"What this means. Buyers: you have more options and more negotiating room than you have had in two years. Use it. Ask for seller concessions on closing costs. Sellers: price your home correctly from day one. The days of listing 10% above market and getting multiple offers are over in most Austin neighborhoods."
"Want to know what is happening in your specific zip code? DM me 'MARKET' and I will send you a neighborhood-level breakdown. I am Sarah Chen, your Austin real estate expert."
That is 189 words. At a conversational speaking pace, it takes about 75 seconds to deliver. Perfect for Instagram Reels. For YouTube, expand each metric with more context, add year-over-year comparisons, and include screen-recorded charts showing the trends visually.
Script Template 2: The Trend Alert
This is a shorter, more urgent format for when something notable happens in your market mid-month. A sudden shift in inventory, a rate change, a new development announcement, or a local policy change that affects housing. Target length: 30 to 60 seconds.
Structure
HOOK (0 to 5 seconds)
"[Surprising thing] just happened in [City] real estate, and [buyers/sellers/homeowners] need to know about it."
THE NEWS (5 to 25 seconds)
"[What happened]. [One sentence of context: is this normal, unprecedented, expected?]. [One sentence of why it matters to the average person]."
WHAT TO DO (25 to 45 seconds)
"If you are [affected group], here is what I would do: [specific, actionable advice]. If you are [other affected group]: [specific, actionable advice]."
CTA (45 to 60 seconds)
"Questions? Drop them in the comments or DM me. I will respond to every one."
Example Script (Filled In)
"Mortgage rates just dropped below 6% for the first time since 2024, and every buyer in Denver should be paying attention."
"The 30-year fixed rate hit 5.87% this morning. That is down from 6.4% three months ago. On a $500,000 home with 20% down, your monthly payment just dropped by about $180. That is $2,160 per year in your pocket instead of the bank's."
"If you are a buyer who has been sitting on the sidelines waiting for rates to come down: this is what you were waiting for. Talk to your lender today about getting pre-approved at this rate. Rates can move back up just as fast as they came down. If you are a seller: expect more buyer activity in the next 30 days. This is a good window to list if you have been on the fence."
"Drop your questions below. I will answer every single one."
That is 150 words, roughly 45 seconds. Fast, punchy, immediately useful. These trend alert videos often outperform comprehensive monthly recaps because the urgency drives engagement. People comment, share with friends who are house-hunting, and tag their partner. The algorithm loves all of that activity.
Script Template 3: The Buyer/Seller Tip
This template takes one piece of market data and turns it into a practical tip for a specific audience (buyers or sellers). It is the most versatile template because you can produce these weekly from different angles. Target length: 30 to 60 seconds.
Structure
HOOK (0 to 5 seconds)
"If you are [buying/selling] a home in [City] right now, this one stat changes everything."
THE STAT (5 to 15 seconds)
"[Stat] is currently at [number]. [One sentence explaining what this metric means in plain English]."
THE PRACTICAL TIP (15 to 40 seconds)
"What most [buyers/sellers] do not realize is [insight from the data]. Here is how to use this to your advantage: [specific tactic or strategy]. This works because [brief explanation]."
CTA (40 to 60 seconds)
"Save this for when you need it. Follow for more [City] real estate tips every week."
Example Script (Filled In)
"If you are selling a home in Phoenix right now, this one stat changes your entire pricing strategy."
"The list-to-sale price ratio in Phoenix just dropped to 97.2%. That means the average home is selling for 2.8% below asking price. Six months ago, that number was 99.1%."
"What most sellers do not realize: the homes dragging that average down are the ones that were overpriced from day one. Homes that are priced correctly (within 3% of market value based on recent comps) are still selling at 99% or higher. The problem is not the market. The problem is pricing strategy. If your agent suggests listing 5% above your highest comp, find a different agent. That strategy worked in 2022. In 2026, it gets you 60 days on market and a price reduction that signals desperation."
"Save this. Share it with a friend who is thinking about selling. Follow for weekly Phoenix market insights."
This format works because it takes abstract data and makes it personally relevant. "97.2% list-to-sale ratio" means nothing to most people. "Your home might sell for $14,000 less than you expect if your agent prices it wrong" means everything.

Filming Your Market Update: The 15-Minute Method
Once you have your script (or bullet points, if you prefer a more natural delivery), the actual filming takes less time than you think. Here is the step-by-step process.
Setup (5 Minutes)
- Position yourself in front of a clean background with natural light coming from in front of you (not behind you). A window to your left or right at 45 degrees is ideal.
- Mount your phone on the tripod at eye level. Horizontal for YouTube, vertical for Instagram/TikTok.
- Clip on your lapel microphone.
- Frame yourself from the chest up, slightly off-center. Leave a little headroom but not too much. You want your eyes roughly in the top third of the frame.
- Do a 10-second test recording. Play it back. Check that audio is clear, lighting is even, and you are in focus.
Recording (5 to 8 Minutes)
- Read through your script or bullet points once silently to get the flow in your head.
- Hit record. Deliver the hook. Pause for a beat. Continue through the metrics. Pause between sections (you will edit these pauses out).
- If you stumble, do not stop recording. Just pause, take a breath, and redo the sentence. It is much easier to edit out a mistake than to restart the entire take.
- Do two full takes. The first one gets the nerves out. The second one is usually the keeper.
Editing (5 to 10 Minutes)
You do not need Final Cut Pro. CapCut (free) or InShot (free with paid features) are more than sufficient for market update videos. Here is the editing checklist:
- Trim the beginning (remove the awkward pause before you start talking) and the end.
- Cut any major stumbles or long pauses.
- Add text overlays for each key metric as you say it. The viewer should be able to understand the data with the sound off.
- Add a title card at the beginning: "[City] Market Update | [Month Year]"
- Add your name, title, and contact info as a lower-third graphic.
- Optional: add background music at very low volume (10 to 15% of your voice level). Subtle background music makes the video feel more polished without distracting from the content.
Total time from start to exported video: 15 to 25 minutes. If you batch-film (record your monthly recap and 3 to 4 weekly tips in one sitting), you can produce an entire month of market update content in about 45 minutes.
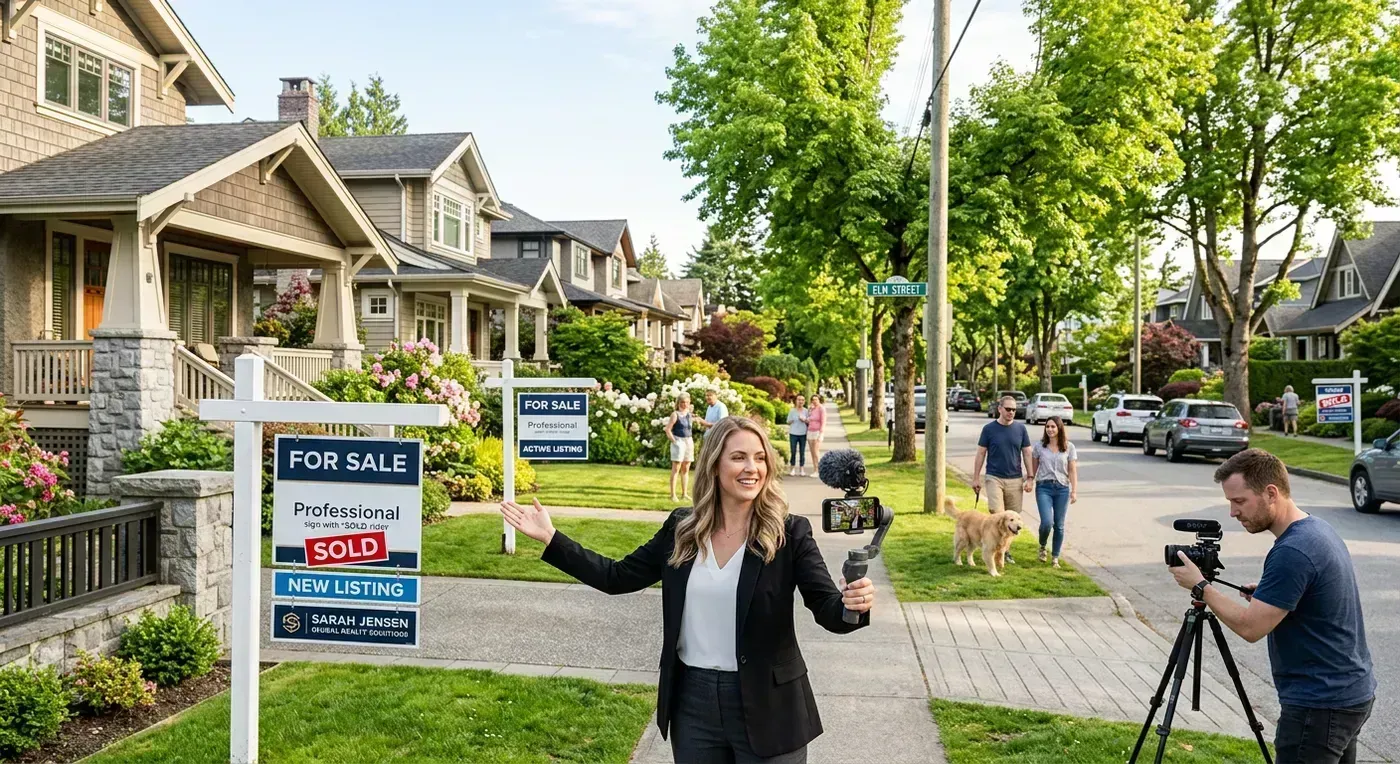
Here is what polished real estate video content looks like when it all comes together:
The Repurposing Cascade
| Day | Content | Source Material | Platform |
|---|---|---|---|
| Monday | Full monthly recap video | Original video | YouTube, Facebook |
| Tuesday | 30-second clip: most surprising stat | Cut from original | Instagram Reels, TikTok |
| Wednesday | Static carousel: 5 key metrics | Data from video | Instagram Feed, LinkedIn |
| Thursday | 30-second clip: buyer tip | Cut from original | Instagram Reels, TikTok |
| Friday | Text post: "One number every [City] homeowner should know" | Key stat from video | Facebook, LinkedIn |
| Saturday | Instagram Story poll: "Did this month's data surprise you?" | Topic from video | Instagram Stories |
| Sunday | Email newsletter with video embed | Original video + summary |
Seven pieces of content. One filming session. That is the efficiency that makes market updates sustainable long-term. You are not creating new content seven times per week. You are creating it once and repackaging it for different audiences and formats.
How to Cut Clips from the Full Video
In CapCut or InShot, find the section where you discuss a single metric. Cut it into a standalone 30-to-45-second clip. Add a new text hook at the beginning (the hook for the clip should be different from the hook for the full video). Add a CTA at the end. Export. You can cut 3 to 4 clips from a single monthly recap in about 15 minutes.
Creating Static Posts from Video Data
Take the key metrics from your video and create Instagram carousel slides in Canva. Each slide covers one metric: slide 1 is the hook ("February 2026 Market Snapshot"), slides 2 through 5 each cover one metric with a clean visual and one-sentence explanation, slide 6 is your CTA and contact info. Carousels get high save rates because people bookmark them as reference material.
Making Data Interesting (Because Numbers Are Boring)
The biggest mistake agents make with market updates is treating them like quarterly earnings calls. Nobody outside of Wall Street finds a monotone recitation of statistics compelling. You are competing for attention with dog videos and cooking tutorials. The data needs personality.
Lead with Surprise
Your hook should be the most unexpected stat. "Phoenix homes are now selling slower than they did during the 2008 crash" gets attention. "The median sale price in Phoenix is $445,000" does not. Find the stat that makes someone stop scrolling and think "Wait, really?" If none of your data is genuinely surprising, find a comparison that makes it feel surprising.
Use Concrete Comparisons
Abstract numbers are forgettable. Comparisons are sticky.
- Instead of: "There are 4,200 active listings." Say: "There are 4,200 homes for sale in Austin right now. Last year there were 3,500. That is 700 more options for buyers. If you spent every Saturday touring 3 homes, it would take you 26 years to see them all."
- Instead of: "Mortgage rates are at 5.9%." Say: "Mortgage rates are at 5.9%. On a $450,000 home, that is $2,663 per month. When rates were 7.1% eighteen months ago, the same house cost $3,033 per month. You are saving $370 per month without doing anything differently."
- Instead of: "Average days on market is 38." Say: "Homes are selling in 38 days on average. That is about as long as it takes to binge three seasons of a TV show. Your house will be under contract before you finish Severance."
The comparisons do not have to be serious. In fact, the slightly funny ones are the most memorable. One agent I know compared her city's inventory levels to "trying to feed 10 people with 3 tacos." Her followers loved it. They started commenting their own analogies. Engagement went through the roof.
Make It Personal
Convert percentages to dollar amounts that apply to your viewer. "Prices are up 4%" means nothing. "If you bought a $400,000 home last year, it is now worth approximately $416,000. You made $16,000 in equity while watching Netflix" means something. People care about what data means for their wallet. Always translate the abstract into the personal.
Common Mistakes to Avoid
I have watched a concerning number of real estate market update videos in my life (research, I promise), and these are the mistakes I see over and over.
- Too many metrics. Three to five key data points per video. Maximum. If you try to cover 12 metrics in 90 seconds, you are going to sound like an auctioneer and your audience is going to retain exactly zero of it. Pick the three most important or interesting numbers and go deep on those.
- No practical takeaway. Sharing data without telling people what to do with it is like giving someone a weather forecast without telling them whether to bring an umbrella. Every metric needs a "so what" sentence. "Prices are up 4%. So what? If you are a seller, this is the strongest pricing position you have had in 18 months."
- Reading a script word-for-word. Write bullet points, not a script. Looking down at notes or reading from a teleprompter with dead eyes kills the connection. Know your three data points, know your three takeaways, then talk to the camera like you are explaining the market to a friend at dinner. Imperfect delivery with genuine energy beats polished delivery with zero personality every time.
- No consistency. Posting one market update and then disappearing for three months destroys the compound effect. The power of market updates comes from showing up every month (or every week). If you cannot commit to monthly, do not start. Inconsistency is worse than absence because it signals unreliability.
- Ignoring bad news. If prices are dropping, say so. If inventory is piling up, say so. If days on market are increasing, say so. Sugarcoating bad data makes you look either dishonest or uninformed. The agents who build the deepest trust are the ones who tell the truth, even when the truth is uncomfortable. Then they follow the truth with practical advice on how to navigate it.
- Terrible audio. I cannot stress this enough. A video with decent visuals and terrible audio is unwatchable. A video with terrible visuals and decent audio is completely watchable. Prioritize sound. Buy the $20 mic. Film in a quiet room. It is the highest-ROI production improvement you can make.
Scaling Up: From Monthly Updates to a Content Brand
Once you have established a rhythm with monthly market updates, here is how to expand the format into a broader content brand that generates leads consistently.
Add a Name and Visual Identity
Give your market update series a name. "[City] Market Minute." "[Your Name]'s Monthly Market Report." "The [Neighborhood] Numbers." A branded series name makes your content recognizable and gives viewers something to search for and share by name.
Build an Archive
Create a YouTube playlist and a dedicated page on your website for all your market updates. After 6 months, you have a visible track record. After 12 months, you have more local market content than 99% of agents in your area. That archive becomes a powerful asset in listing presentations and client conversations.
Invite Guest Experts
Once a quarter, bring on a lender to discuss rate trends, a home inspector to discuss seasonal maintenance, or a tax professional to discuss property tax implications. Guest episodes provide fresh perspectives, introduce you to the guest's audience, and add credibility to your content brand.
Pair Market Updates with Listing Content
Your market update says "it is a great time to buy in [Neighborhood]." Your next post is a listing video from that exact neighborhood. The market context makes the listing content more relevant, and the listing content makes the market data more tangible. For those listing videos, AI tools like Reel-E let you generate professional property tours from your listing photos in minutes, so you always have fresh property content to pair with your market analysis.
Getting Started This Week
You have the scripts. You have the data sources. You have the distribution plan. Here is your homework.
- Today: Pull last month's key stats from your MLS. Write three bullet points: most interesting stat, buyer takeaway, seller takeaway.
- Tomorrow: Set up your phone on a tripod, clip on a mic, and film your first market update using Template 1. Two takes. Pick the better one. Edit in CapCut (add text overlays for each stat).
- This week: Post the video on Instagram Reels and one other platform. Share it in your Instagram Stories.
- Next month: Do it again. Same template. New data. That is it. Month after month. The compound effect takes over from there.
The agents who dominate their local market on social media are not the most charismatic or the most tech-savvy. They are the most consistent. Market update videos are the easiest content to be consistent with because the content (data) creates itself every month. All you have to do is show up, translate the numbers, and press record.
Fifteen minutes of filming. Fifteen minutes of editing. One month of content. The math works. Start this week.
For a broader approach to finding clients through content marketing, check out our guide on how to find clients in real estate. And for the data behind why video consistently outperforms other content formats, our real estate video statistics analysis has the numbers.